Algebra 2B Lesson 13.4
|
This is an explanation for how to identify one “cycle” on a sinusoidal graph. You first choose a point on the graph. And then find the next occurrence of that same type of point. The easiest points to identify visually are minimums, maximums and x-intercepts, so I always try to use these when I can.
|
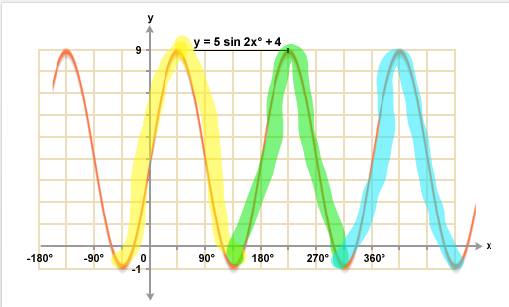
Here’s an example graph where I highlighted three cycles. Using the yellow color, I started at one of the maximums and then I followed the graph to the next occurrence of the maximum. That’s one cycle highlighted in yellow. I did the same steps in blue and then in red. So I’ve highlighted three cycles.
|
Three cycles maximum to maximum
|
|
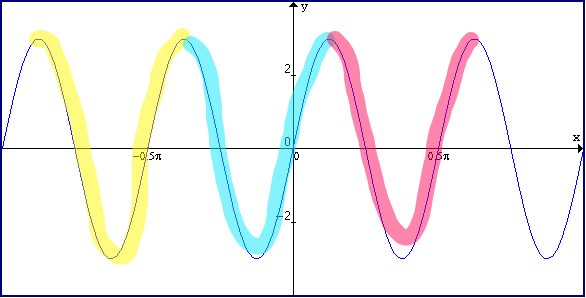
Here’s another example, but this time I started at a minimum instead. I highlighted until I reached the next minimum. Then I did the same with green and blue.
|
Three cycles minimum to minimum
|
The picture below is a graph of function: y = cos (3x).
- You’ll see that I highlighted three cycles between x = 0 and x = 2pi. It's very common for questions to ask about a graph's behavior within just these x-values.
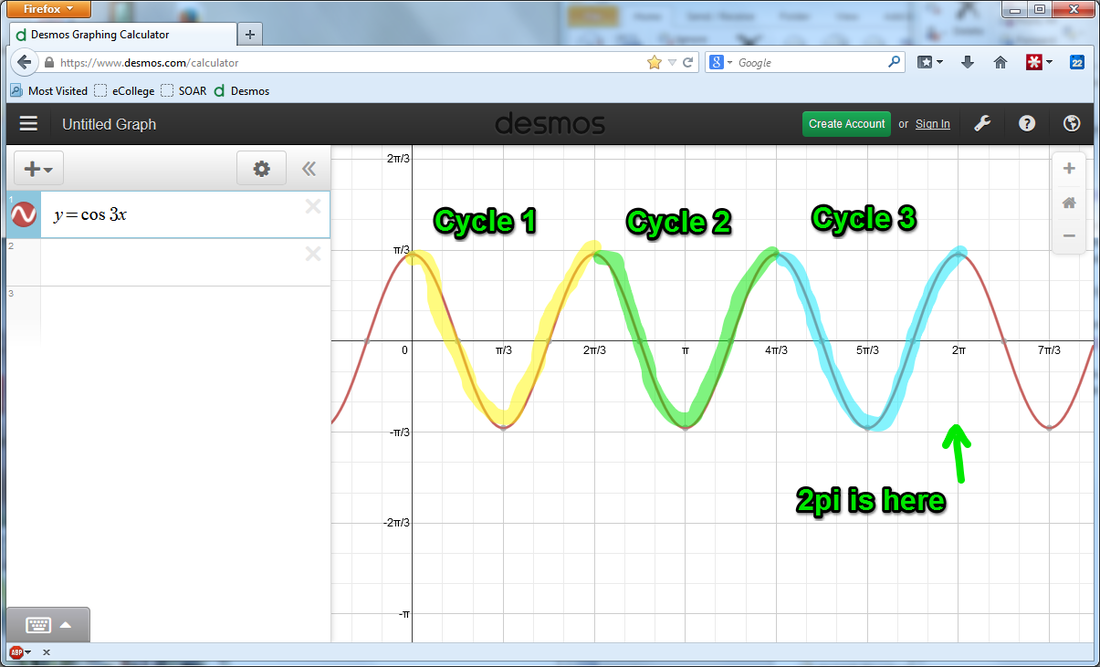
Three cycles from zero to 2pi
This next picture is a graph of function: y = sin ( (x/2) + (pi/2)).
- You’ll see that one full cycle actually goes from x = 0 all the way to x = 4pi. So this graph is much “wider” than the previous graph.
- This means that only half of one cycle lies between x = 0 and x = 2pi.
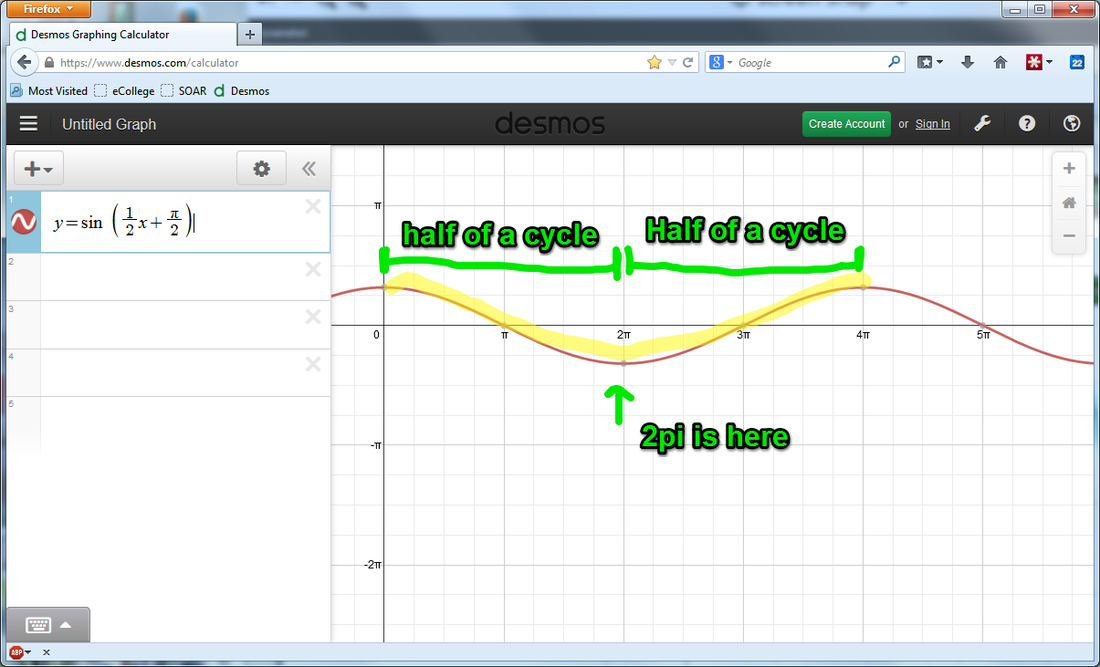
Half of a cycle between zero and 2pi
This is the graph for the function: y = cos (5pi / 2)
- You should see that between x =0 and x = 2pi, there are two and a half cycles.
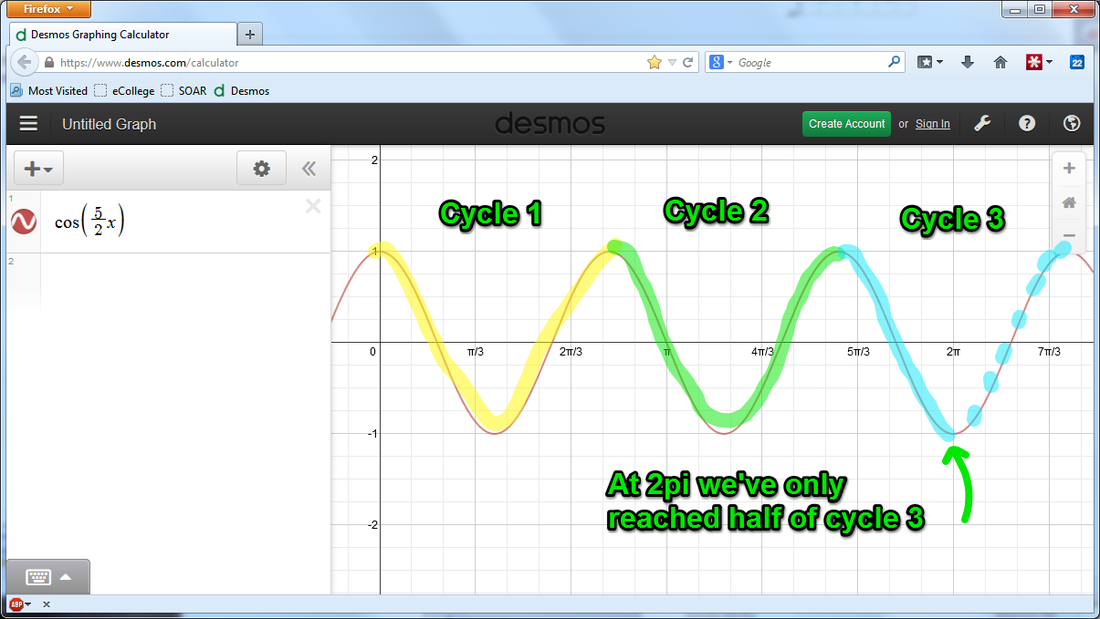
Two and a half cycles
